Premium Circuits: Metrics
Projection of Economic Metrics Post-Premium Circuit Implementation
This upcoming sections outline the projected economic metrics following the implementation of premium paid circuits within the Anyone Network. The projections are based on assumptions regarding user adoption and application integration post-launch. The purpose of the graph included in this section is to qualitatively demonstrate the dynamic interplay between various economic factors as the network matures and premium services become operational.
Assumptions and Basis for Projections
Launch Timeline: Premium circuits are expected to begin around Q1 2025, marking the start of paid services within the network - it will follow the introduction of custom circuits to the client prior to that.
Application Growth: The network anticipates integration with:
3 applications initially.
5-10 applications after 3 months.
25 applications after 6 months.
User Adoption and Revenue Estimates:
Initial adoption by 10k paying users for the top third of applications, with realistic 2k for other apps.
Average monthly expenditure per user is estimated at $1-2, considering the infrequent usage pattern of most services.
Revenue Projections:
$14k USD per month in the beginning.
$44k USD per month at 3 months.
$100k USD per month in a better realistic case at 6 months.
Growth Rate: Post-initial phase, a 10% increase in revenue per 30-days is assumed.
Graphical Representation
The graph will visually represent the following key metrics:
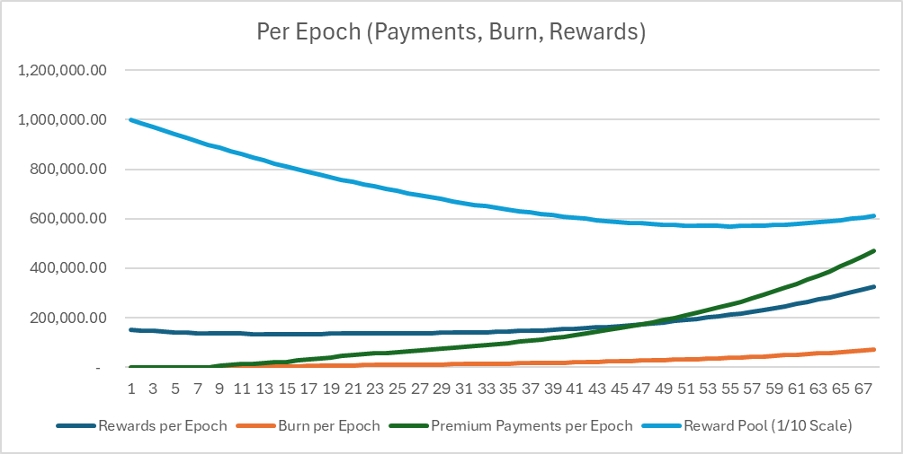
Tokens Left in the Reward Pool: Illustrates the initial decrease using a traditional decay function. As premium paid circuits begin, the decay rate slows, reflecting the restocking of the reward pool from premium payments.
Total Rewards Given Out: Tracks the total amount of rewards distributed to network participants over time.
Total Premium Rewards: Shows the amount of rewards specifically allocated from premium service payments, highlighting the growing importance of these services in the network's economy.
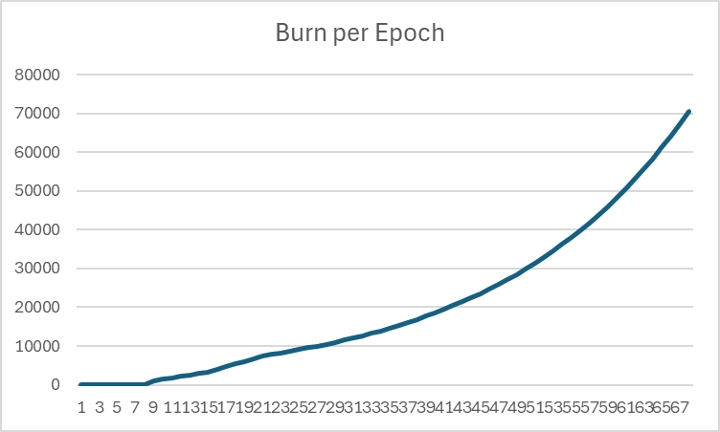
Total Burn: Represents the cumulative amount of tokens permanently removed from circulation. The graph will depict an increase in token burn per epoch, correlating with the growth in premium circuit usage.
Key Points and Inflection in Graph
Inflection Point: The graph will feature an inflection point where the rate of reward pool restocking equates to the rate of reward payout. This is a critical juncture where the decay in the reward pool balances with the inflow from premium payments, after which the reward pool is projected to begin increasing.
Visualization of Economic Design: The purpose of including this graph is to provide a clear visual representation of the intended economic mechanisms at play within the Anyone Network. It aims to show stakeholders how strategic design choices are expected to stabilize and then grow the network's economic foundation through premium services.
Graphs
The following graph is a per-epoch graph of rewards, burn, premium payments, and the remaining reward pool. The Reward pool is shown at 1/10th scale in order to showcase the other lines in a meaningful way.

The following graph is an isolated burn per epoch graph:

Conclusion
This section and the accompanying graphs are essential for conveying the long-term economic strategy of the Anyone Network. By demonstrating how the introduction of premium paid circuits is expected to transform the network's economic landscape, stakeholders can better appreciate the foresight and planning involved in the network's development. The graph acts not only as a predictive tool but also as an illustrative aid that aligns theoretical economic principles with practical implementation and expected outcomes.